

We recognize the importance of properly managing water resources, especially their proper and rational use, as well as the controlled extraction of water from surface and underground sources for the company’s operational processes.
It should be noted that the water resource represents a basic element for the proper development of our processes and activities, especially those processes that require cooling, steam production and washing of impurities.
We manage water resources responsibly and rationally as part of operational controls to reduce effluent generation in our operations.
Likewise, we adopt measures to use water resources sustainably, of which we highlight the following: at the technological level, we modernize our equipment; at Talara, we use water from the sea through our desalination plant; at the operational level, we implement wastewater treatment plants and their reuse; at the user level, we promote the responsible consumption of water resources.
The areas of non-industrial services or management control of each headquarters account for the consumption of their water resources. For this measurement, they use contometers or receipts provided by supplier companies.
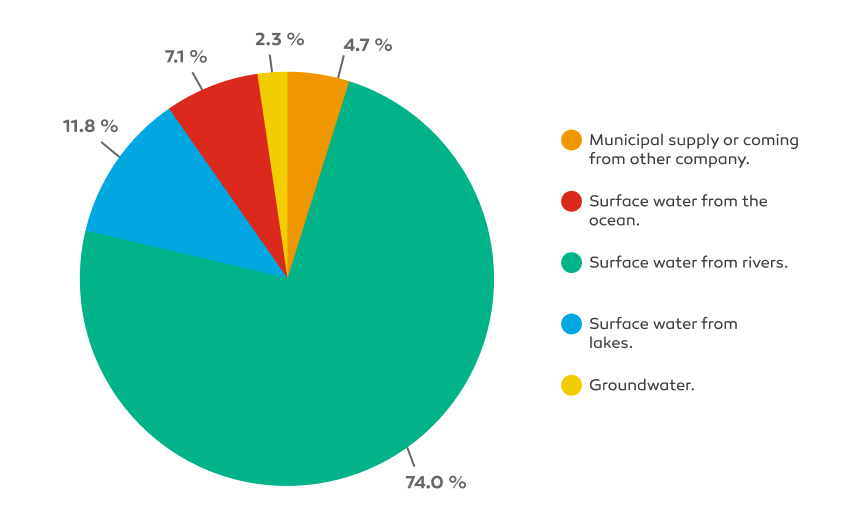
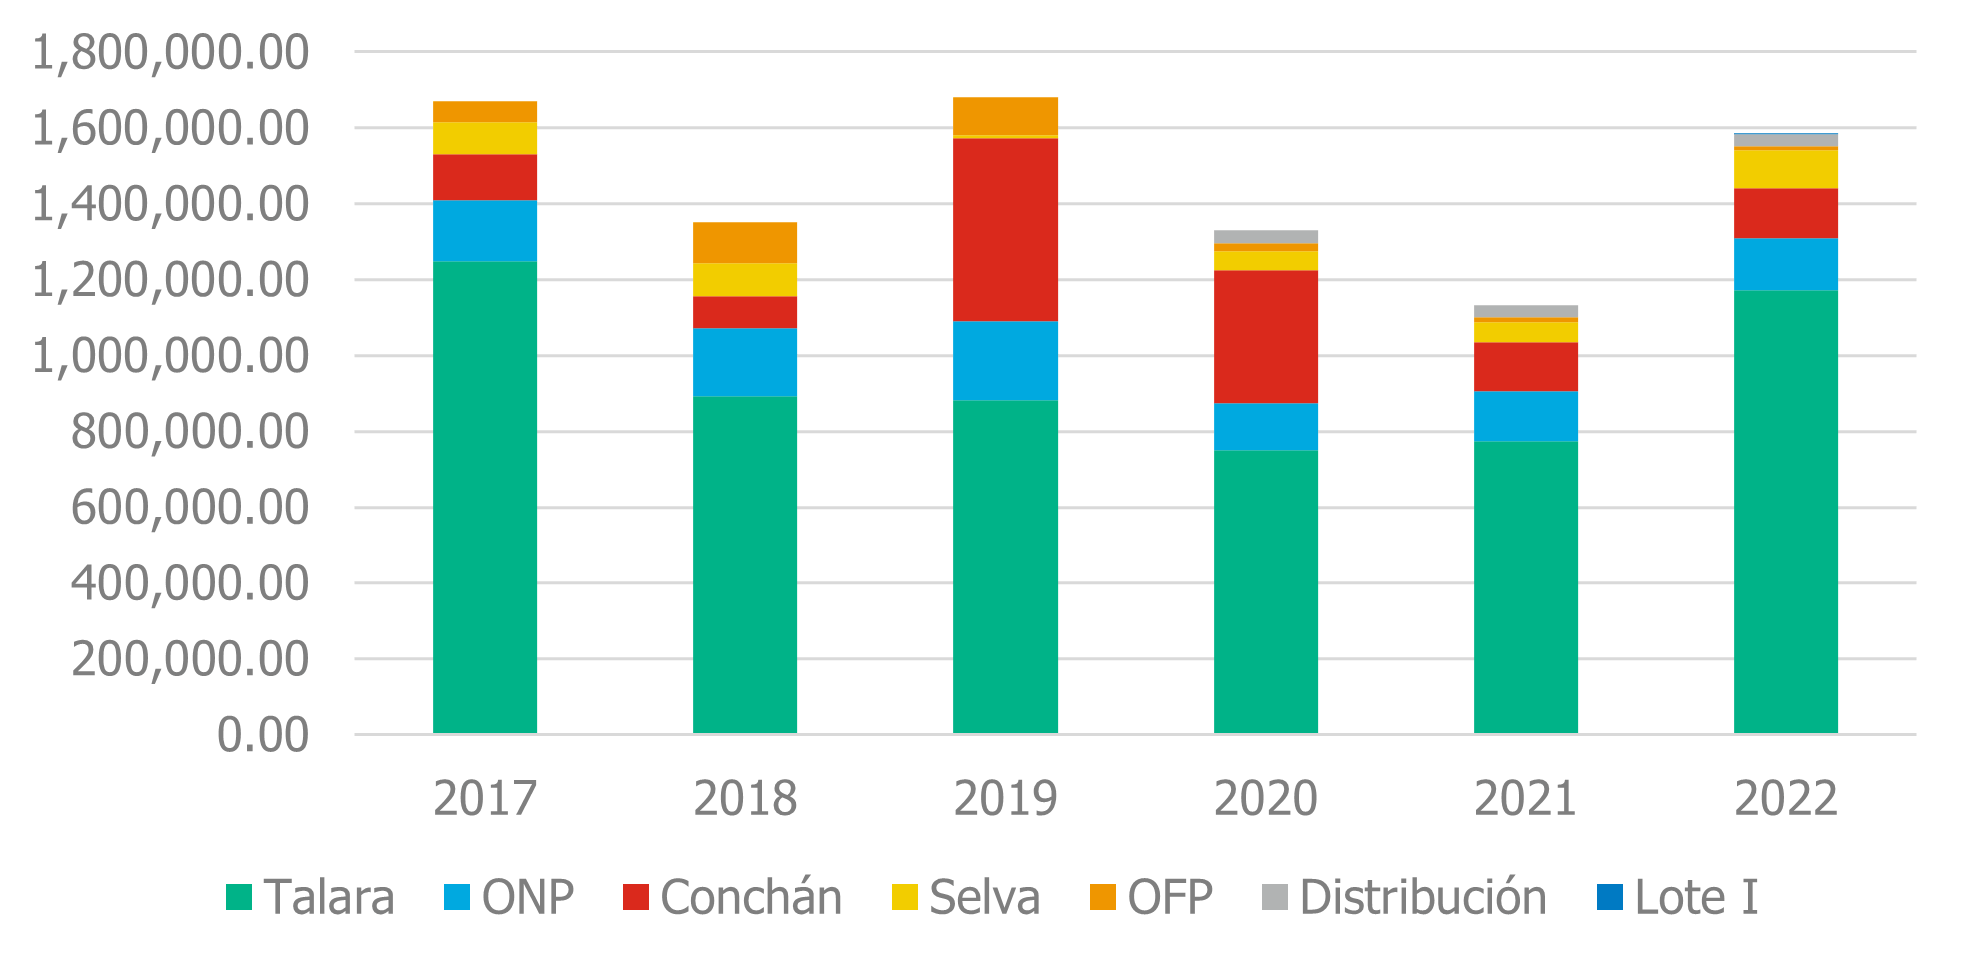
During 2022, we extracted a total of 1,585,184.45m3 (1585.18 megaliters) of water, of which 74% comes from the sea. The water extraction is in accordance with the authorized volumes and water rights granted by the competition entity.
| Operation | Surface water | Groundwater | Municipal supply/other company | Total | |
|---|---|---|---|---|---|
| Head Office | 0.00 | 0.00 | 12,968.00 | 12,968.00 | |
| Conchán Refinery* | 112,967.00 | 0.00 | Water Tank | 19,328.88 | 132,295.88 |
| Drum | 63.60 | ||||
| Talara Refinery | 1,172,407.42 | 0.00 | 0.00 | 1,172,407.42 | |
| Iquitos Refinery | 97,203.88 | 0.00 | 1610.00 | 98,813.88 | |
| North Peruvian Pipeline (ONP) | 90,524.68 | 37,118.00 | 9065.00 | 136,707.68 | |
| Plants and terminals | 0.00 | 0.00 | 30,754.99 | 30,754.99 | |
| Lot I | 0.00 | 0.00 | 1173.00 | 1173.00 | |
| Total | 300,695.56 | 37,118.00 | 1,247,370.89 | 1,585,184.45 | |
Source: Sustainable Development Corporate Management.
(*) The actual consumption records of the meter are presented, which is within the authorization range of the ANA.
| Source Type | Total extraction (m3) | Percentage |
|---|---|---|
| Municipal supply or coming from other company | 74,963.47 | 4.7% |
| Surface water from the ocean | 1,172,407.42 | 74.0% |
| Surface water from rivers | 187,728.56 | 11.8% |
| Surface water from the lake | 112,967.00 | 7.1% |
| Groundwater | 37,118.00 | 2.3% |
| Total | 1,585,184.45 |
Source: Sustainable Development Corporate Management.
| Source Type/Location | Head Office | Conchán Refinery | Talara Refinery | Iquitos Refinery | ONP | Plants and terminals | Total |
|---|---|---|---|---|---|---|---|
| Municipal supply or coming from other company | 12,968 | 19,392 | 0 | 1610 | 9065 | 30,755 | 1,246,198 |
| Surface water from the ocean | 0 | 0 | 1,172,407 | 0 | 0 | 0 | 1,172,407 |
| Surface water from rivers | 0 | 0 | 0 | 97,204 | 90,525 | 0 | 187,729 |
| Surface water from the lake | 0 | 112,967 | 0 | 0 | 0 | 0 | 112,967 |
| Groundwater | 0 | 0 | 0 | 0 | 37,118 | 0 | 37,118 |
| Total | 12,968 | 132,359 | 1,172,407 | 98,814 | 136,708 | 30,755 | 1’584,011 |
Source: Sustainable Development Corporate Management.

Source: Sustainable Development Corporate Management.

In areas with water stress, such as the department of Piura, we supply ourselves with seawater to reduce the pressure of groundwater and surface water. We avoid competing with neighboring populations for the use of water, since they require it for their consumption. In total, during 2022, 1,327,927.90 m3 (1327.97 megaliters) of water were extracted in areas of water stress.
| Operation | Surface water | Groundwater | Municipal supply/other company | Total | |
|---|---|---|---|---|---|
| Head Office | 0.00 | 0.00 | 12,968.00 | 12,968.00 | |
| Conchán Refinery** | 112,967.00 | 0.00 | Water Tank | 19,328.88 | 132,295.88 |
| Drum | 63.60 | ||||
| Talara Refinery | 1,172,407.42 | 0.00 | 0.00 | 1,172,407.42 | |
| North Peruvian Pipeline (ONP) – Bayóvar only | 0.00 | 0.00 | 9,065.00 | 136,707.68 | |
| Lot I | 0.00 | 0.00 | 1173.00 | 1173.00 | |
| Total | 1,285,374.42 | 0.00 | 42,598.48 | 1,327,972.90 | |
Source: Sustainable Development Corporate Management.
(**) The actual consumption records of the meter are presented, which is within the authorization range of the ANA.
For more information on the distribution of major operations in water stress areas, according to Aqueduct, you can visit the following link: https://www.wri.org/applications/aqueduct/country-rankings/

Regarding the management of our effluents, our operations must comply with the maximum permissible limits established in Supreme Decree No. 037-2008-PCM, Establish Maximum Permissible Limits of Liquid Effluents for the Hydrocarbons Subsector. In this line, the analytical results of the monitoring carried out on the effluents at the frequency established in their respective environmental management instrument of each operation, which is reported to the Environmental Assessment and Control Agency (OEFA).
Below are the regulated parameter values for Liquid Effluent Maximum Permissible Limits (LMPs).
| Regulated parameter | Maximum permissible limits (mg/l) (concentrations at any time) |
|---|---|
| Total Petroleum Hydrocarbons (TPH) | 20 |
| Chloride | 20 |
| Hexavalent chromium | 500 (to rivers, lakes and reservoirs) |
| Total Chromium | 2000 (estuaries) |
| Mercury | 0.1 |
| Cadmium | 0.5 |
| Arsenic | 0.2 |
| Phenols for FCC refinery effluents | 0.5 |
| Sulfides for FCC refinery effluents | 1.0 |
| Biochemical Oxygen Demand (BOD) | 50 |
| Chemical Oxygen Demand (COD) | 250 |
| Residual chlorine | 0.2 |
| Ammoniacal nitrogen | 40 |
| Total coliforms (NMP/100 mL) | < 1000 |
| Fecal coliforms (NMP/100 mL) | < 400 |
| Phosphorus | 2.0 |
| Barium | 5.0 |
| pH | 6.0 – 9.0 |
| Oils & grease | 20 |
| Lead | 0.1 |
| Temperature Increase*** | < 3°C |
Note. (***) Increase with respect to the ambient temperature of the receiving body measured at 100 m in diameter from the pouring point.