


We are aware that the use of fuels has an impact on the atmosphere, as well as the role played by the companies that supply these products. Therefore, we are committed to continue contributing to the development of the country, guaranteeing the production and marketing of quality fuels and introducing improvements to reduce and control its own emissions.
Although the company carries out periodic environmental monitoring of its emissions on a frequent basis in compliance with current legal regulations, in 2022, the Board of Directors requested a new process for formulating the Annual and Five-Year Objectives of Petroperú, for the period 2023 – 2027; aligned with the National Energy Policy and the international requirements ratified by the country such as the Paris Agreement.
Faced with this request, the Administration has been working on a specific objective that includes Carbon Footprint Management with activities that include:
The Greenhouse Gas (GHG) Emission Inventory is our main tool to measure our carbon footprint. To carry it out, we use the methodology established in 2006 by the IPCC and the annual sectoral greenhouse gas reports (RAGEI, 2019) of the Infocarbon platform of the Ministry of Environment in those cases in which the compendium did not provide greater guidance for the calculation of emissions from certain GHG sources not directly associated with the oil industry. These methodologies allow us to convert the emissions of different gases into a standard unit: tCO2eq.
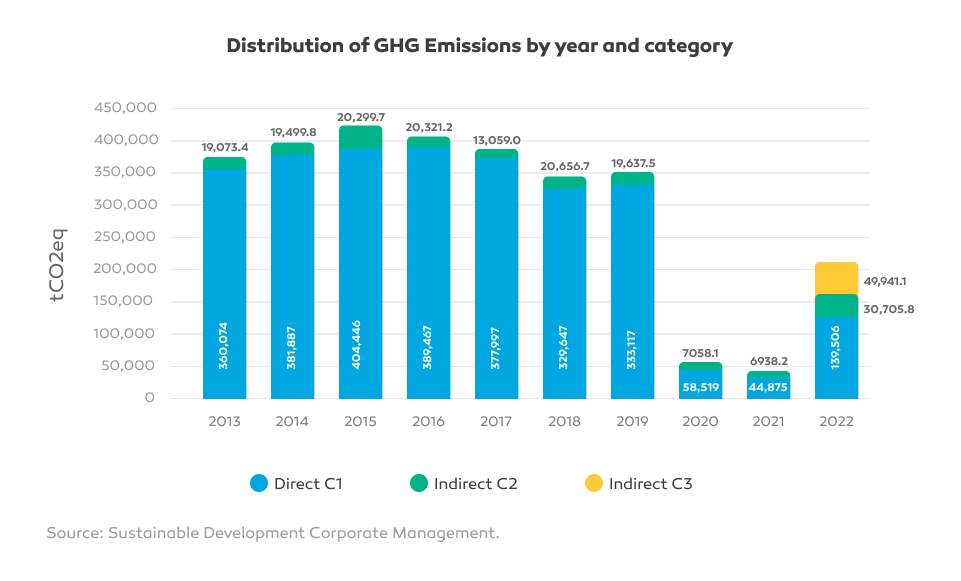
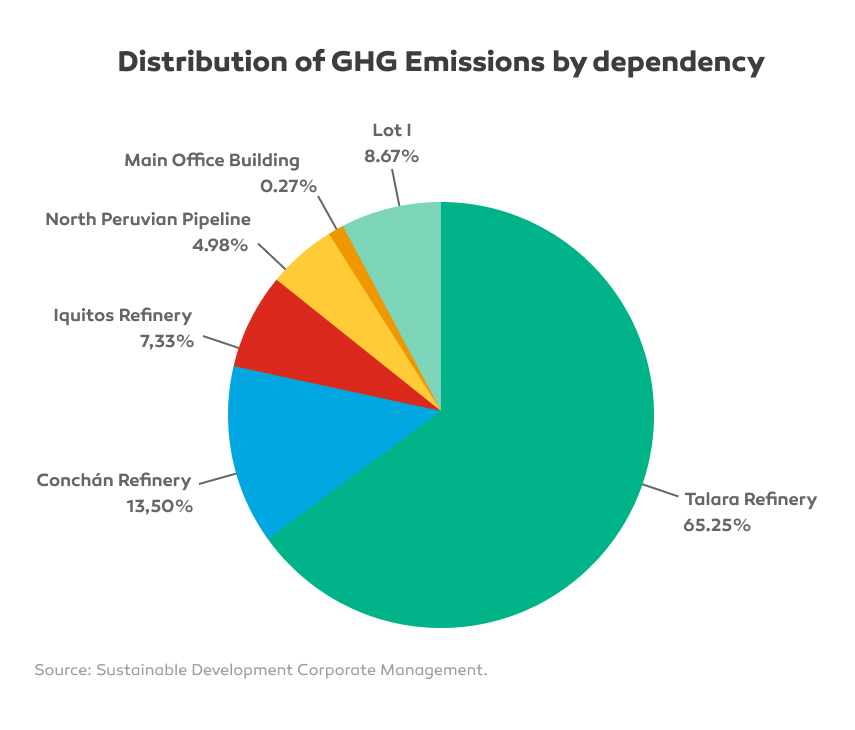
The quantification and consolidation of Petroperú’s GHG emissions is approached from the operational control approach. Under that approach, all activities and facilities in which the Company has full authority to introduce and implement its respective operational, environmental and industrial safety and occupational health standards were considered within the GHG emissions inventory. In that sense, this report contains information corresponding to the GHG emissions of Talara, Conchán, Iquitos, Lot I, the North Peruvian Pipeline and the company’s main office, which have generated a total of 170,211.66 tCO2eq in Categories 1 (Direct Emissions) and 2 (Indirect Emissions from Energy Purchases).
For the measurement of our carbon footprint, carbon dioxide (CO2), nitrous oxide (N2O) and methane (CH4) gases have been included.
On the other hand, Category 3 emissions have been estimated for the first time, which are carried out by our Product Land Transportation contractors, both to the sales plants and to our main industrial customers; such as the river transport of Inputs which has generated a total of 49,941.13 tCO2eq.
| Dependency | Categories (ISO standard) | Total | ||
|---|---|---|---|---|
| Category 1 | Category 2 | Category 3 | ||
| tCO2eq | tCO2eq | tCO2eq | tCO2eq | |
| Talara Refinery | 82,796.10 | 28,273.65 | Corporate | 111,069.75 |
| Conchán Refinery | 21,469.36 | 1511.88 | 22,981.25 | |
| Iquitos Refinery | 12,259.78 | 215.29 | 12,475.07 | |
| North Peruvian Pipeline | 8215.18 | 260.00 | 8475.17 | |
| Head Office | 17.28 | 440.77 | 458.06 | |
| Lot I | 14,748.20 | 4.16 | 14,752.36 | |
| Total | 139,505.90 | 30,705.75 | 49,941.13 | 220,152.78 |
Source: Sustainable Development Corporate Management.
As evidenced in Table 16,65% of GHG emissions came from Talara Refinery operations. Likewise, Table 18 shows that the emissions
Regarding the source of direct emissions (fixed and mobile), they are the most relevant, with 63.93% in relation to the total.
| Other emissions | tCO2 | % |
|---|---|---|
| Biomass combustion C1 + C2 | 275.13 | 16 |
| Biomass combustion C3 | 1400.42 | 84 |
| Total | 1675.55 | 100 |
| Emissions | Operation | tCO2 | tCH4 | tN2O | tCO2eq | Percentage |
|---|---|---|---|---|---|---|
| Direct emissions (1) | Combustion sources | 139,225.84 | 2.97 | 0.40 | 139,424.40 | 63.33% |
| Sources of venting/process | 0.00 | 0.00 | 0.00 | 0.00 | 0.00% | |
| Fugitive emissions | 0.00 | 2.69 | 0.01 | 81.51 | 0.04% | |
| Indirect emissions (2) | Use of electricity | 30,606.19 | 1.56 | 0.19 | 30,705.75 | 13.95% |
| Indirect Emissions (3) | Supplies transportation | 49,152.88 | 3.08 | 2.55 | 49,941.13 | 22.68% |
| Total | 218,984.90 | 10.30 | 3.15 | 220,152.78 | 100.00% | |
Source: Sustainable Development Corporate Management.
It is important to emphasize that, for the first time, we estimated the Category 3 emissions of our contractors for the land transport (fuel tanks) and river transport of inputs (fuel transport barges), this could be calculated from the number of trips made in 2022 and an approximate km per gallon yield. In this framework, we estimate the generation of 49,941.13 tCO2eq.
| Activity | Carbon dioxide | Methane | Nitrous Oxide | Total |
|---|---|---|---|---|
| tCO2 | tCH4 | tN2O | tCO2eq | |
| Ground transportation for the supply of sales plants | 35,820.82 | 2.23 | 1.80 | 36,377.35 |
| Ground transportation supplying industrial customers | 7682.73 | 0.48 | 0.38 | 7802.09 |
| River transport | 7049.75 | 0.37 | 0.37 | 7162.10 |
| Sub Total | 50,553.30 | 3.08 | 2.55 | 51,341.55 |
| Biomass Emissions C3 | 1400.42 | |||
| Total | 49,941.13 |
Source: Sustainable Development Corporate Management.